One of the most important steps when working with models is evaluating them. Although using them with handpicked examples can provide us with some intuition about their performance, that might not be enough. This is when metrics come into play.
If we look up the definition of metrics on the Internet, a very simple one will be "Metrics are numbers that tell you important information about a process under question". Therefore, they can help us to assess a model’s performance or gain insights into our dataset. As there are a lot of concepts to deal with (recall, precision, capitalness…) and they are not very self-explanatory, it is best to put them into practice.
This video summarizes the use of Rubrix Metrics and some of the features it provides:
Rubrix and metrics: a nice match
With its data exploration mode and logged model predictions, getting a first quick intuition about your data and models is very easy with Rubrix. If you want to go further, Rubrix also provides metrics that give you measurable insights into your dataset, and enable you to assess your model’s performance in a more fine-grained way.
Their main goal is to make the process of building robust training data and models easier, going beyond single-number metrics. Rubrix metrics are inspired by a number of seminal works, such as Explainaboard.
Our experiment
We decided that to make metrics more accessible to Rubrix users, we could give them a practical example analyzing an annotated dataset and one or two suitable models. If you want to follow along with this experiment and reproduce our analysis, you can find all the necessary steps in this GitHub repo.
The dataset
We decided to use the dataset of the second Track of the 2018 n2c2 challenge, a project aimed to explore Clinical NLP data and tasks (more info here). Track 2 focused on medical records or reports related to adverse drug effects and medications, and was presented as a Named Entity Recognition (NER) task with the following entities: DOSAGE, DRUG, DURATION, FORM, FREQUENCY, ROUTE, STRENGTH, REASON, ADE.
Click here to read more about the dataset and challenge. As it is not an open-source dataset, users have to create an account on the DBMI Data Portal and request access to use it.
The model
We chose the Med7 model by Andrey Kormilitzin, which you can find on his Hugging Face page. This spaCy-based model was partially trained on the dataset described above and was designed to “be robustly used in a variety of downstream” tasks “using free-text medical records”. For this reason, it only focused on 7 of the 9 entities present in the dataset ignoring REASON and ADE. Andrey published two versions of this model: a transformer and a large version. We will use the former one, except stated otherwise.
For our experiment, we just used 12 documents of the nc2c dataset, split the text into sentences using spaCy, and logged these sentences with their annotations and model predictions to Rubrix. This resulted in about ~1600 records.
import rubrix as rb# Check the GitHub repo to see how we created the 'records'rb.log(records, name="med7_trf")So, what about the metrics?
First, we will analyze the metrics directly related to the dataset, and then we will see the ones related to the model.
Dataset metrics
Token Capitalness
First, we will analyze the Token Capitalness. This is the capitalization information for each token in the dataset.
from rubrix.metrics.token_classification import token_capitalnesstoken_capitalness(name="med7_trf").visualize()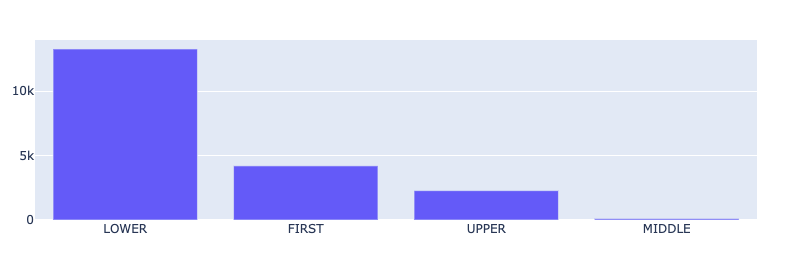
The most common result is LOWER (all the characters in the token are lowercase), followed by FIRST (the first character in the token is a capital letter) and UPPER (all characters are uppercase), and finally MIDDLE (the first character is lowercase and at least one other character it upper case). The relative prominence of FIRST and UPPER is typical for medical records. They contain a lot of sections, titles, short phrases, professional jargon, and abbreviations, such as IV, OP, TID, or QHS, to name a few.
Token Frequency
This metric computes the frequency of each token. Here, the results are both curious and logical:
from rubrix.metrics.token_classification import token_frequencytoken_frequency(name="med7_trf").visualize()
For this dataset, the most frequent tokens by far are the asterisk symbol, followed by the new line character. After inspecting the dataset in more detail, we noticed that asterisks were partially used to anonymize sensitive data (this is a very common practice for medical records). Also, paragraphs are separated by lots of new lines - hence the results.
Token Length
This metric measures the token length distribution based on the number of characters for each token. Knowing the results from above, it is no surprise that, far and away, the most common length is 1. Given the number of abbreviations used in medical records, we also expect short tokens to be unusually prominent in the distribution.
from rubrix.metrics.token_classification import token_lengthtoken_length(name="med7_trf").visualize()
Model metrics
Now that we have seen metrics strictly related to the dataset, let’s have a look at the metrics, but this time we will take into account the predictions of the model.
Entity Consistency
This metric is used to quantify how consistently a particular mention is predicted with a particular label.
from rubrix.metrics.token_classification import entity_consistencyentity_consistency(name="med7_trf").visualize()
In our case only the mention Injection has been predicted with two different labels: 3 times with the label ROUTE and 3 times with the label FORM. This is plausible, since Injection can refer to the way a drug is applied (FORM), as well as to its route of administration (ROUTE).
Entity Labels
This is the distribution of predicted entity labels in our dataset. DRUG is undoubtedly the most common prediction, while mentions of DURATION seem to be less frequent.
from rubrix.metrics.token_classification import entity_labelsentity_labels(name="med7_trf").visualize()
Entity Capitalness
This metric shows the capitalization information of the predicted entity mentions, similar to the token capitalness metric. Since we already saw that DRUG is the most predicted label, and most DRUG mentions are names of medicines (Vancomycin, Oxycodone, Dilatin…), it makes sense that FIRST is the most common capitalness for the predicted entities.
from rubrix.metrics.token_classification import entity_capitalnessentity_capitalness(name="med7_trf").visualize()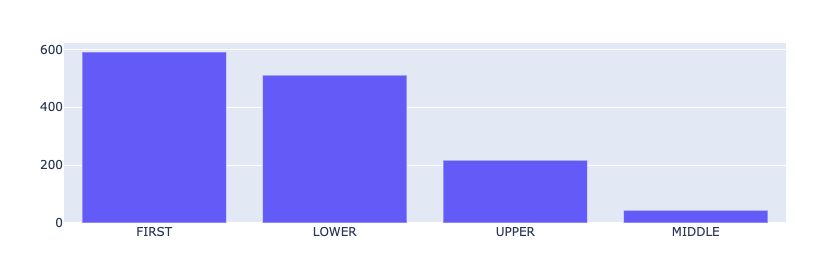
Mention Length
While token length computes the length of a token measured in its number of characters, mention length computes the length of an entity mention measured in its number of tokens. Again, since most of the predicted entities are drugs that are often named with one word, we expected the mention length 1 to be predominant.
from rubrix.metrics.token_classification import mention_lengthmention_length(name="med7_trf").visualize()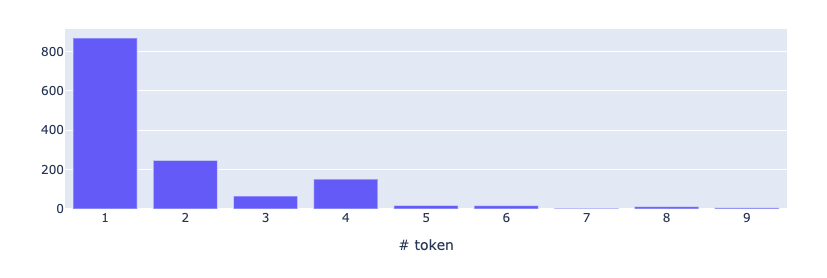
Model performance
Now, let’s see how we can measure the performance of a model and compare it with another in a more fine-grained way.
Averaged F1
A common way to state the performance of a multiclass NER model is to use its averaged F1 score. Let’s use this metric to compare the two versions of our model (transformer vs. large):
from rubrix.metrics.token_classification import f1f1(name="med7_trf").visualize()f1(name="med7_lg").visualize()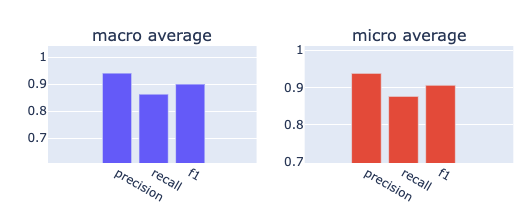
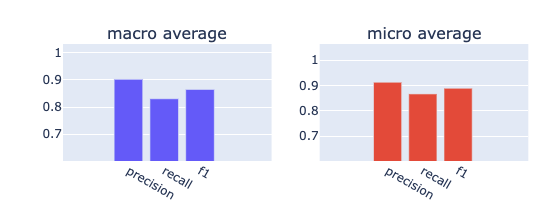
It seems the transformers model outperforms the large model in every aspect. It has a better recall and precision for both micro and macro averages.
Per Label F1
However, if we take a closer look at the F1 scores for each label, we discover that the large model actually performs slightly better for ROUTE and FREQUENCY entities. So if you are mainly interested in detecting routes or frequencies in a medical document, the large model would be the way to go.
Also, it is worth noting that there is a big difference of nearly 0.2 points between the performance of the two models with respect to the DURATION entity.
| Model \ Label | DRUG | FORM | ROUTE | FREQUENCY | DOSAGE | STRENGTH | DURATION |
|---|---|---|---|---|---|---|---|
| TRANSFORMERS | 0.95 | 0.94 | 0.93 | 0.75 | 0.91 | 0.96 | 0.86 |
| LARGE | 0.92 | 0.93 | 0.96 | 0.77 | 0.85 | 0.94 | 0.67 |
Detecting data shifts
Rubrix Metrics can also help you to find data shifts. According to Georgio Sarantitis (2020), “a data shift occurs when there is a change in the data distribution”.
Let’s simulate a data shift by simply lowercasing ~25% of the medical records. The effect on the model performance is minimal but still noticeable (less than 0.01 points in the macro and micro f1 score). However, looking at the entity capitalness distribution, the shift becomes very obvious if you compare it to the original distribution above.

This will help you to detect data shifts early on and adapt your model accordingly, before performance penalties become significant.
Summary
As you can see, Rubrix Metrics is a nice tool to get deeper insights into your data distributions and model performance. We were able to quickly visualize a variety of measurable quantities of the dataset, as well as quickly compare the performance of two models in more detail. Data shifts are also easily detectable with Rubrix Metrics helping you to stay on top when monitoring your models.
But there is more to it than that: this tool not only helps to assess models and analyze data, but it can also provide linguistic information about a specific dataset, or can show additional features. In this case, clinical NLP datasets can be a good fit, as they contain special features and language that are always interesting, such as technical words, abbreviations, or singularities regarding their tokens (e.g. their token length).
If you are new to Rubrix, check our GitHub repo and give it a ⭐ to stay updated. For more information about Rubrix Metrics, please check our summary guide and the API references of the metrics module.


